This is a description on how to perform colour calibration of a camera and a specific photo shoot settings under Linux using the UFRaw RAW format handler and the Argyll Color Management System. This probably works under Windows or OsX as well, but it is untested.
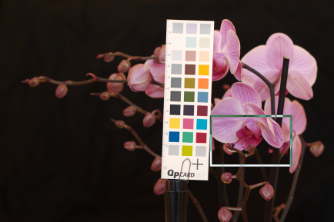
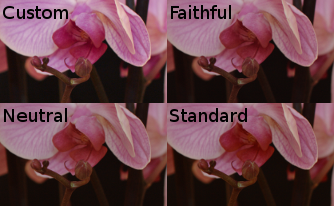
Figure 1: Color Calibration Examples.
After struggling with LPROF and failing to make it work for me (see this how-to), I've reworked my work flow for colour management to incorporate Argyll Color Management System instead. In a related how-to I described how to use the ICC profiles that come with Canon Digital SLR (EOS) together with UFRaw to digitally develop colour calibrated photographs. This how-to describes how you can use the Argyll Color Management System to create your own ICC profile that describes the lighting conditions of a photo session. This profile is then used to develop the RAW photos from your camera with correct colours and brightness.
In figure 1 there is a photograph with the QPCard201 used to calibrate the colours. This is the target, i.e. colour calibration chart, that I've been using and which will be used as an example in this how-to. There is also a set of close-up images showing the results from using the custom profile from this how-to compared to some general profiles that came with the camera. The general profiles required manual white balancing and exposure adjustments to get this close to the custom profile.
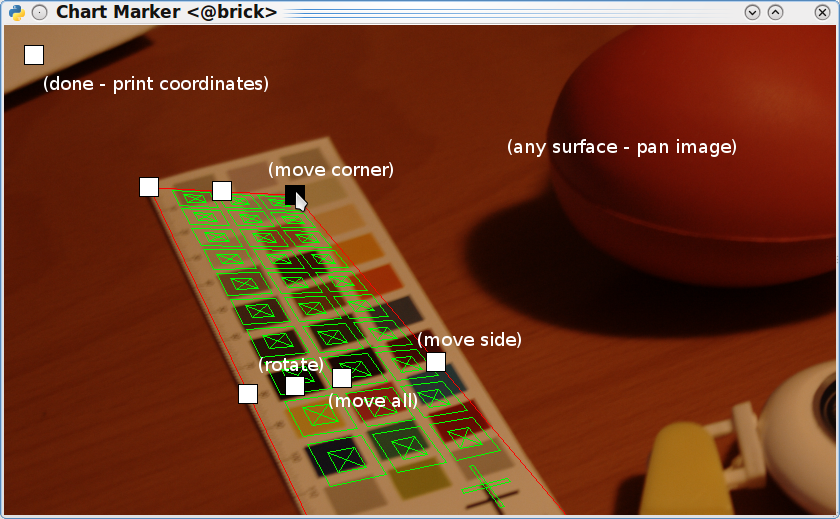
In photography, as opposed to when calibrating a scanner, you will need to manually mark the corners of the target in the picture. This is because the Argyll tool for extracting colour information from the image can detect the orientation of the target only if it is facing the camera, like it would in a scanner. For this I use my own GUI which is shown in figure 2. The usage is straightforward — execute the script without any arguments for a list of command line arguments and click on the screendump for usage information of the actual GUI.
In my work flow I use
- Argyll Color Management System
- UFRaw
- ImageMagick
- GIMP
- My own little target matching GUI
- A fork of the target matching GUI, for Python3
To put this together I used the following resources
- Argyll command-line tool documentation
(
scaninandcolprof) - Argyll target template file format documentation (CHT)
- Forum comments by Nikolay Pokhilchenko
- Forum comments by Graeme Gill
- CHT file by Graeme Gill
See also: